
1
2
3
4
5
6
7
8
9
10
11
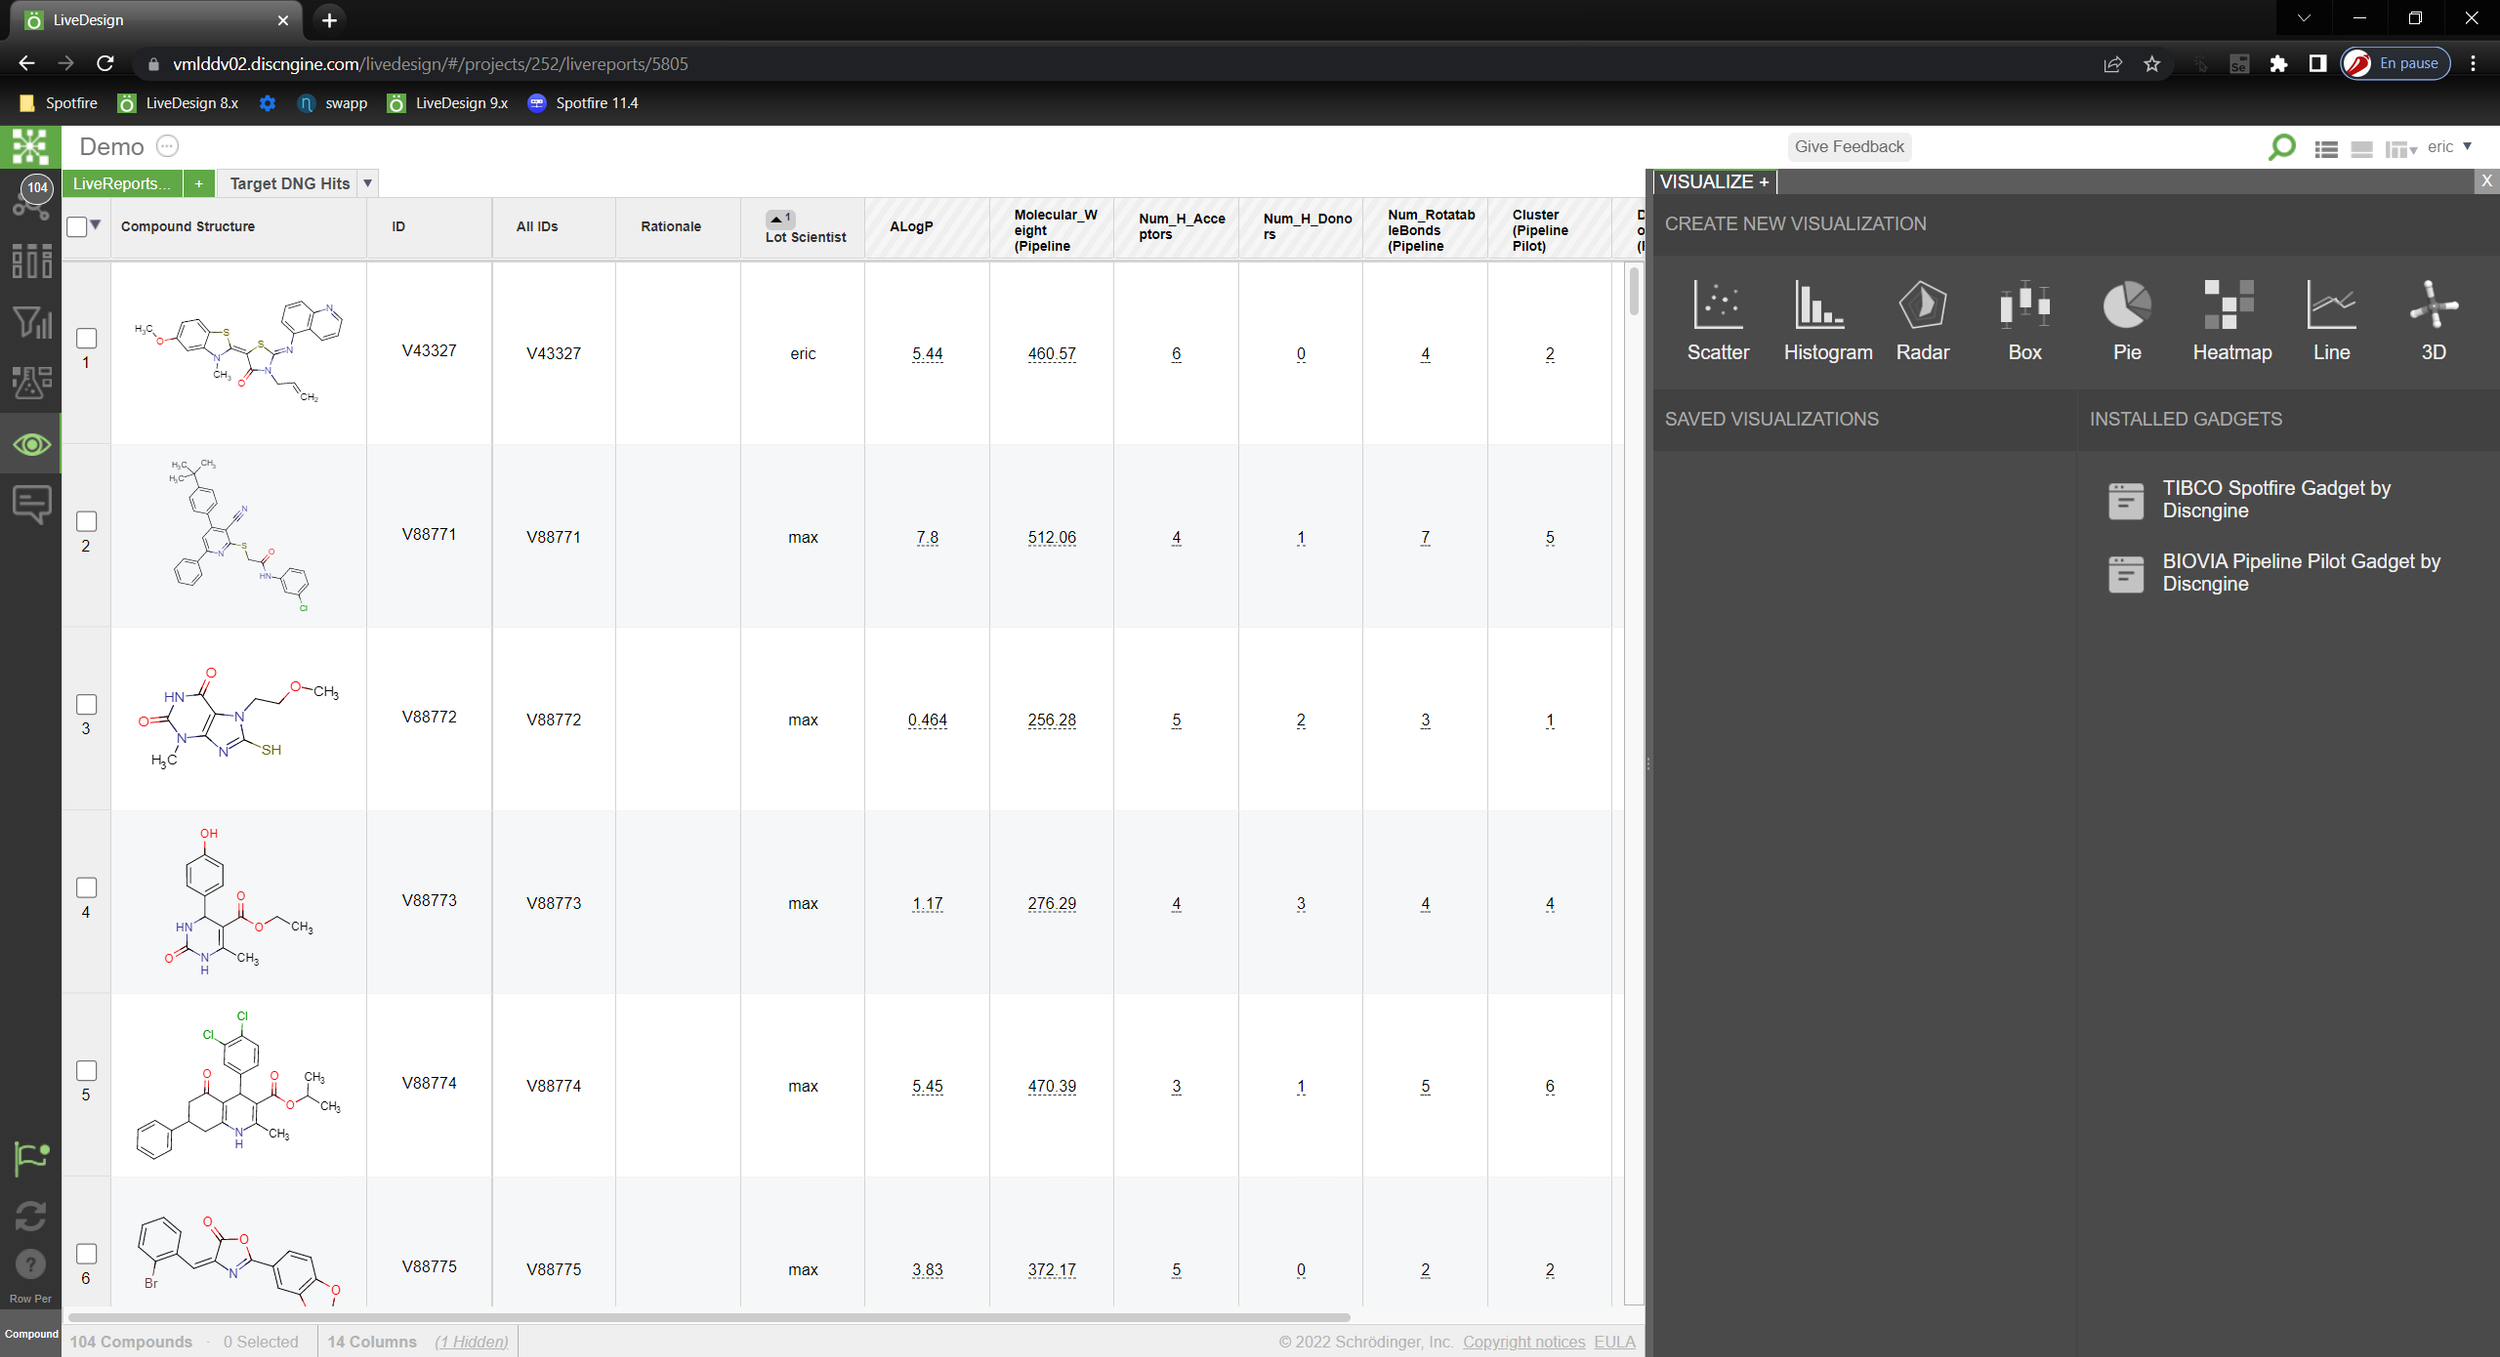
Step 1: Open “TIBCO Spotfire Gadget by Discngine”
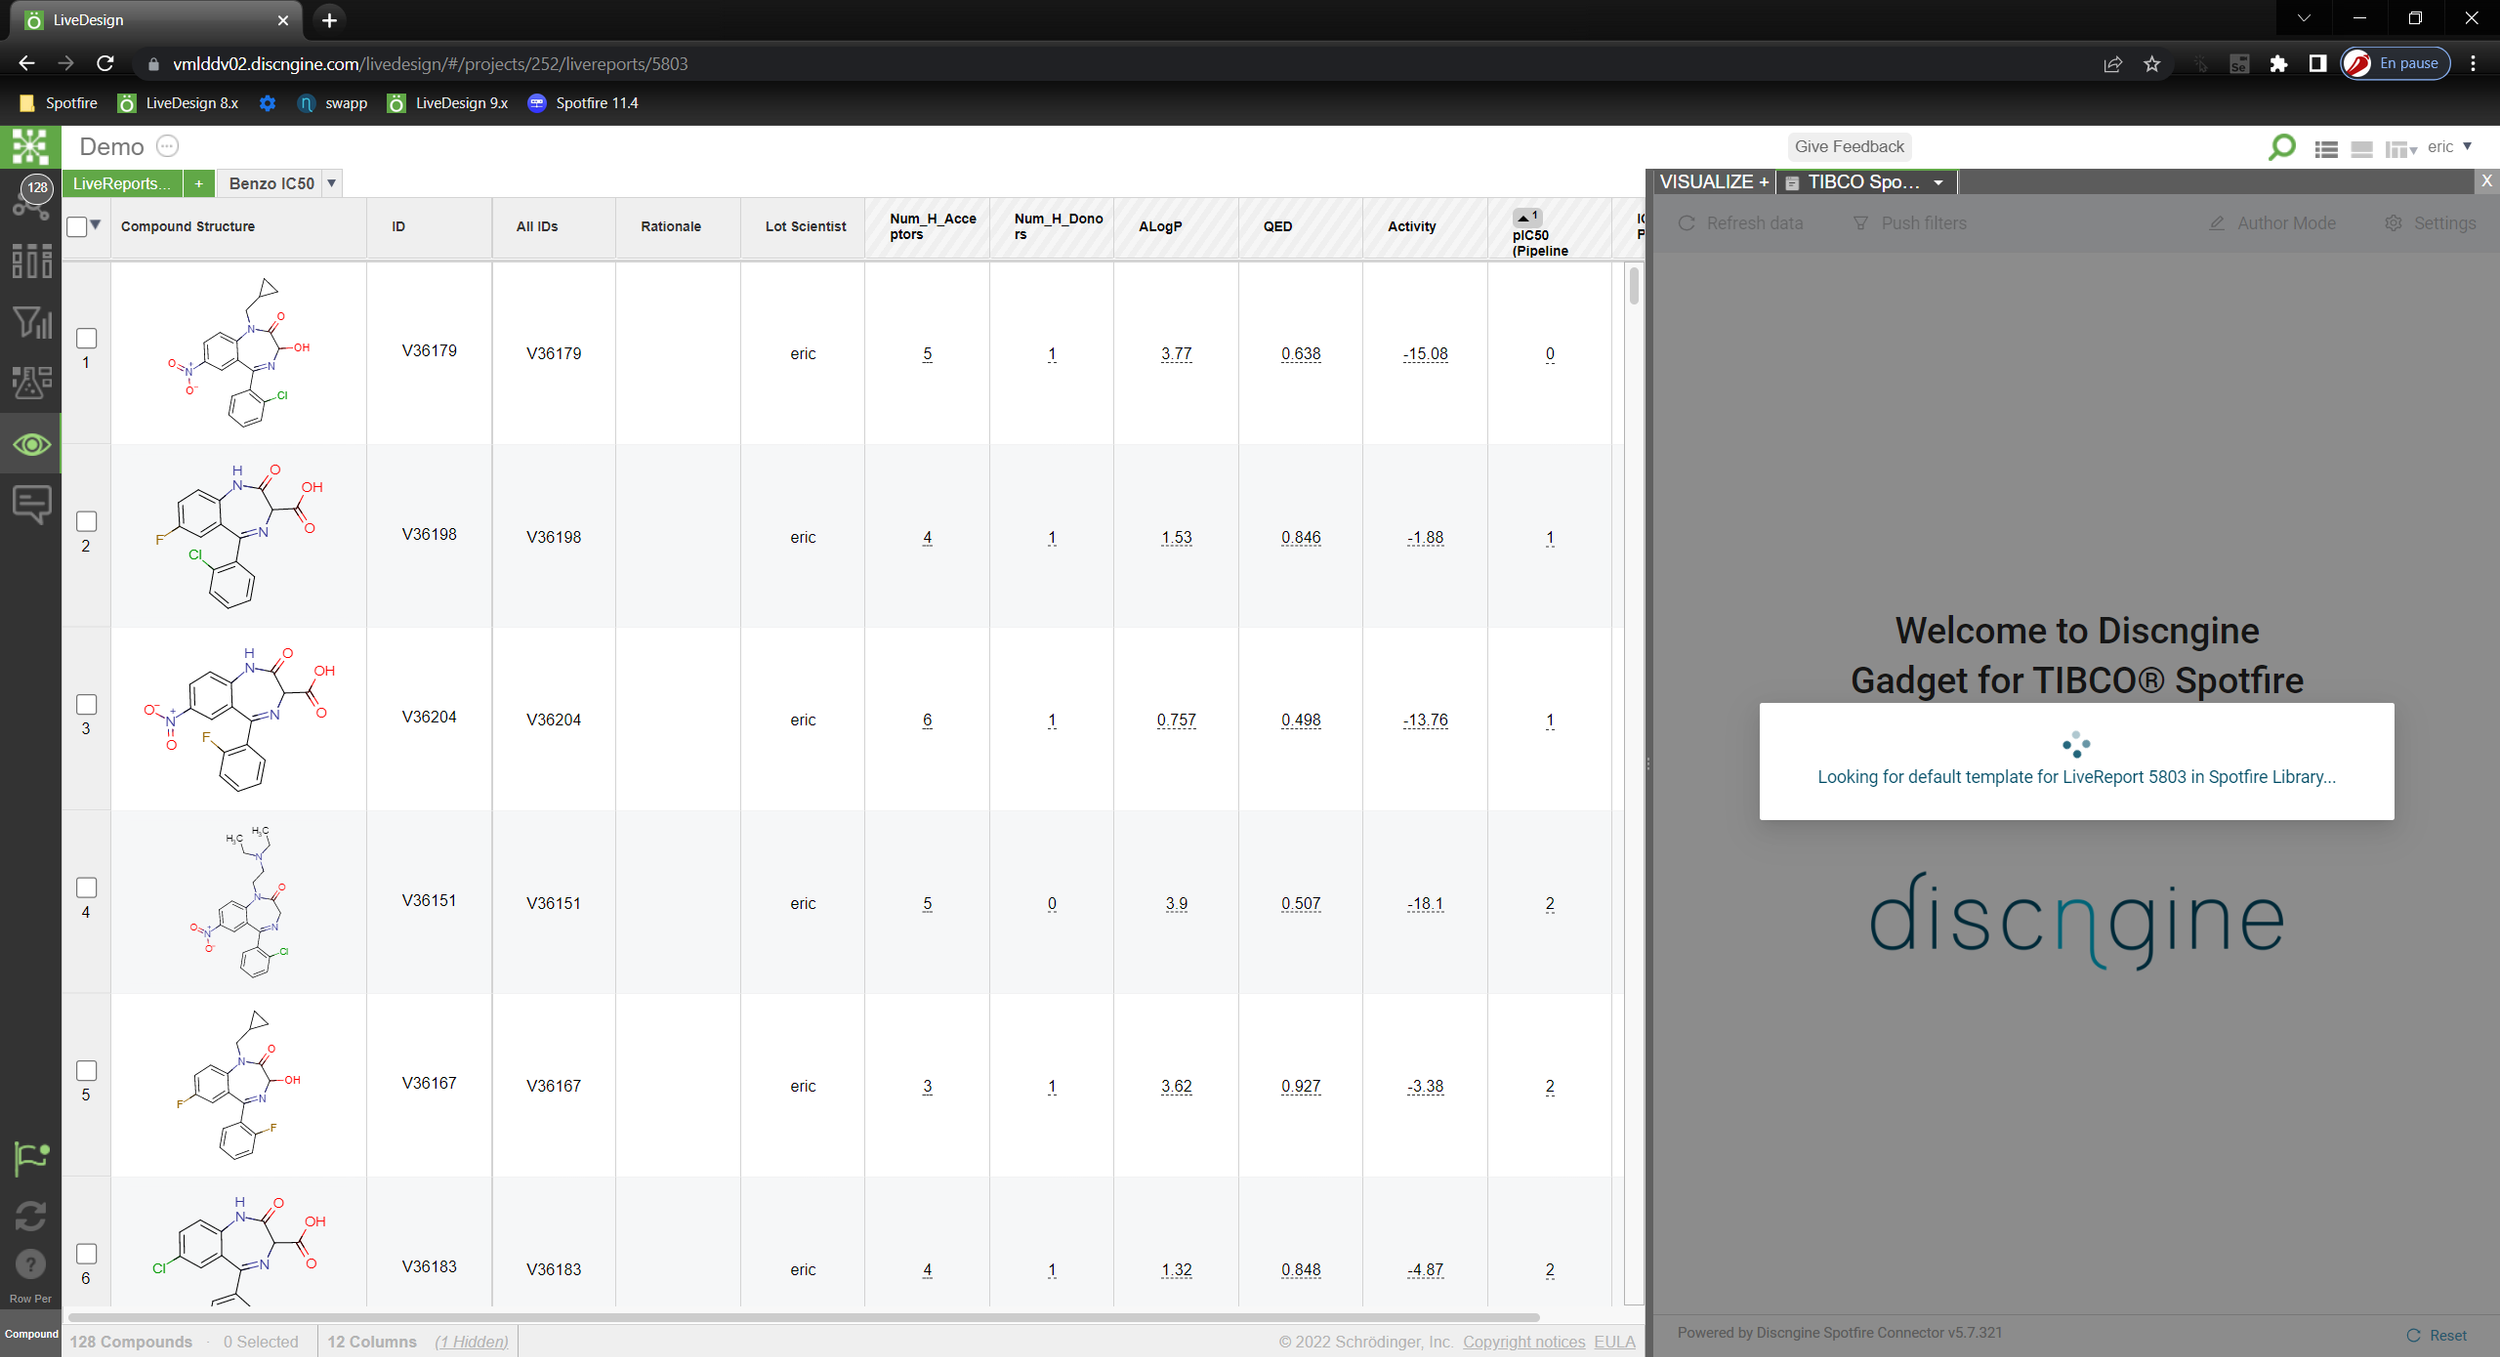
Step 2: The Spotfire Connector Gadget is searching for default Spotfire template
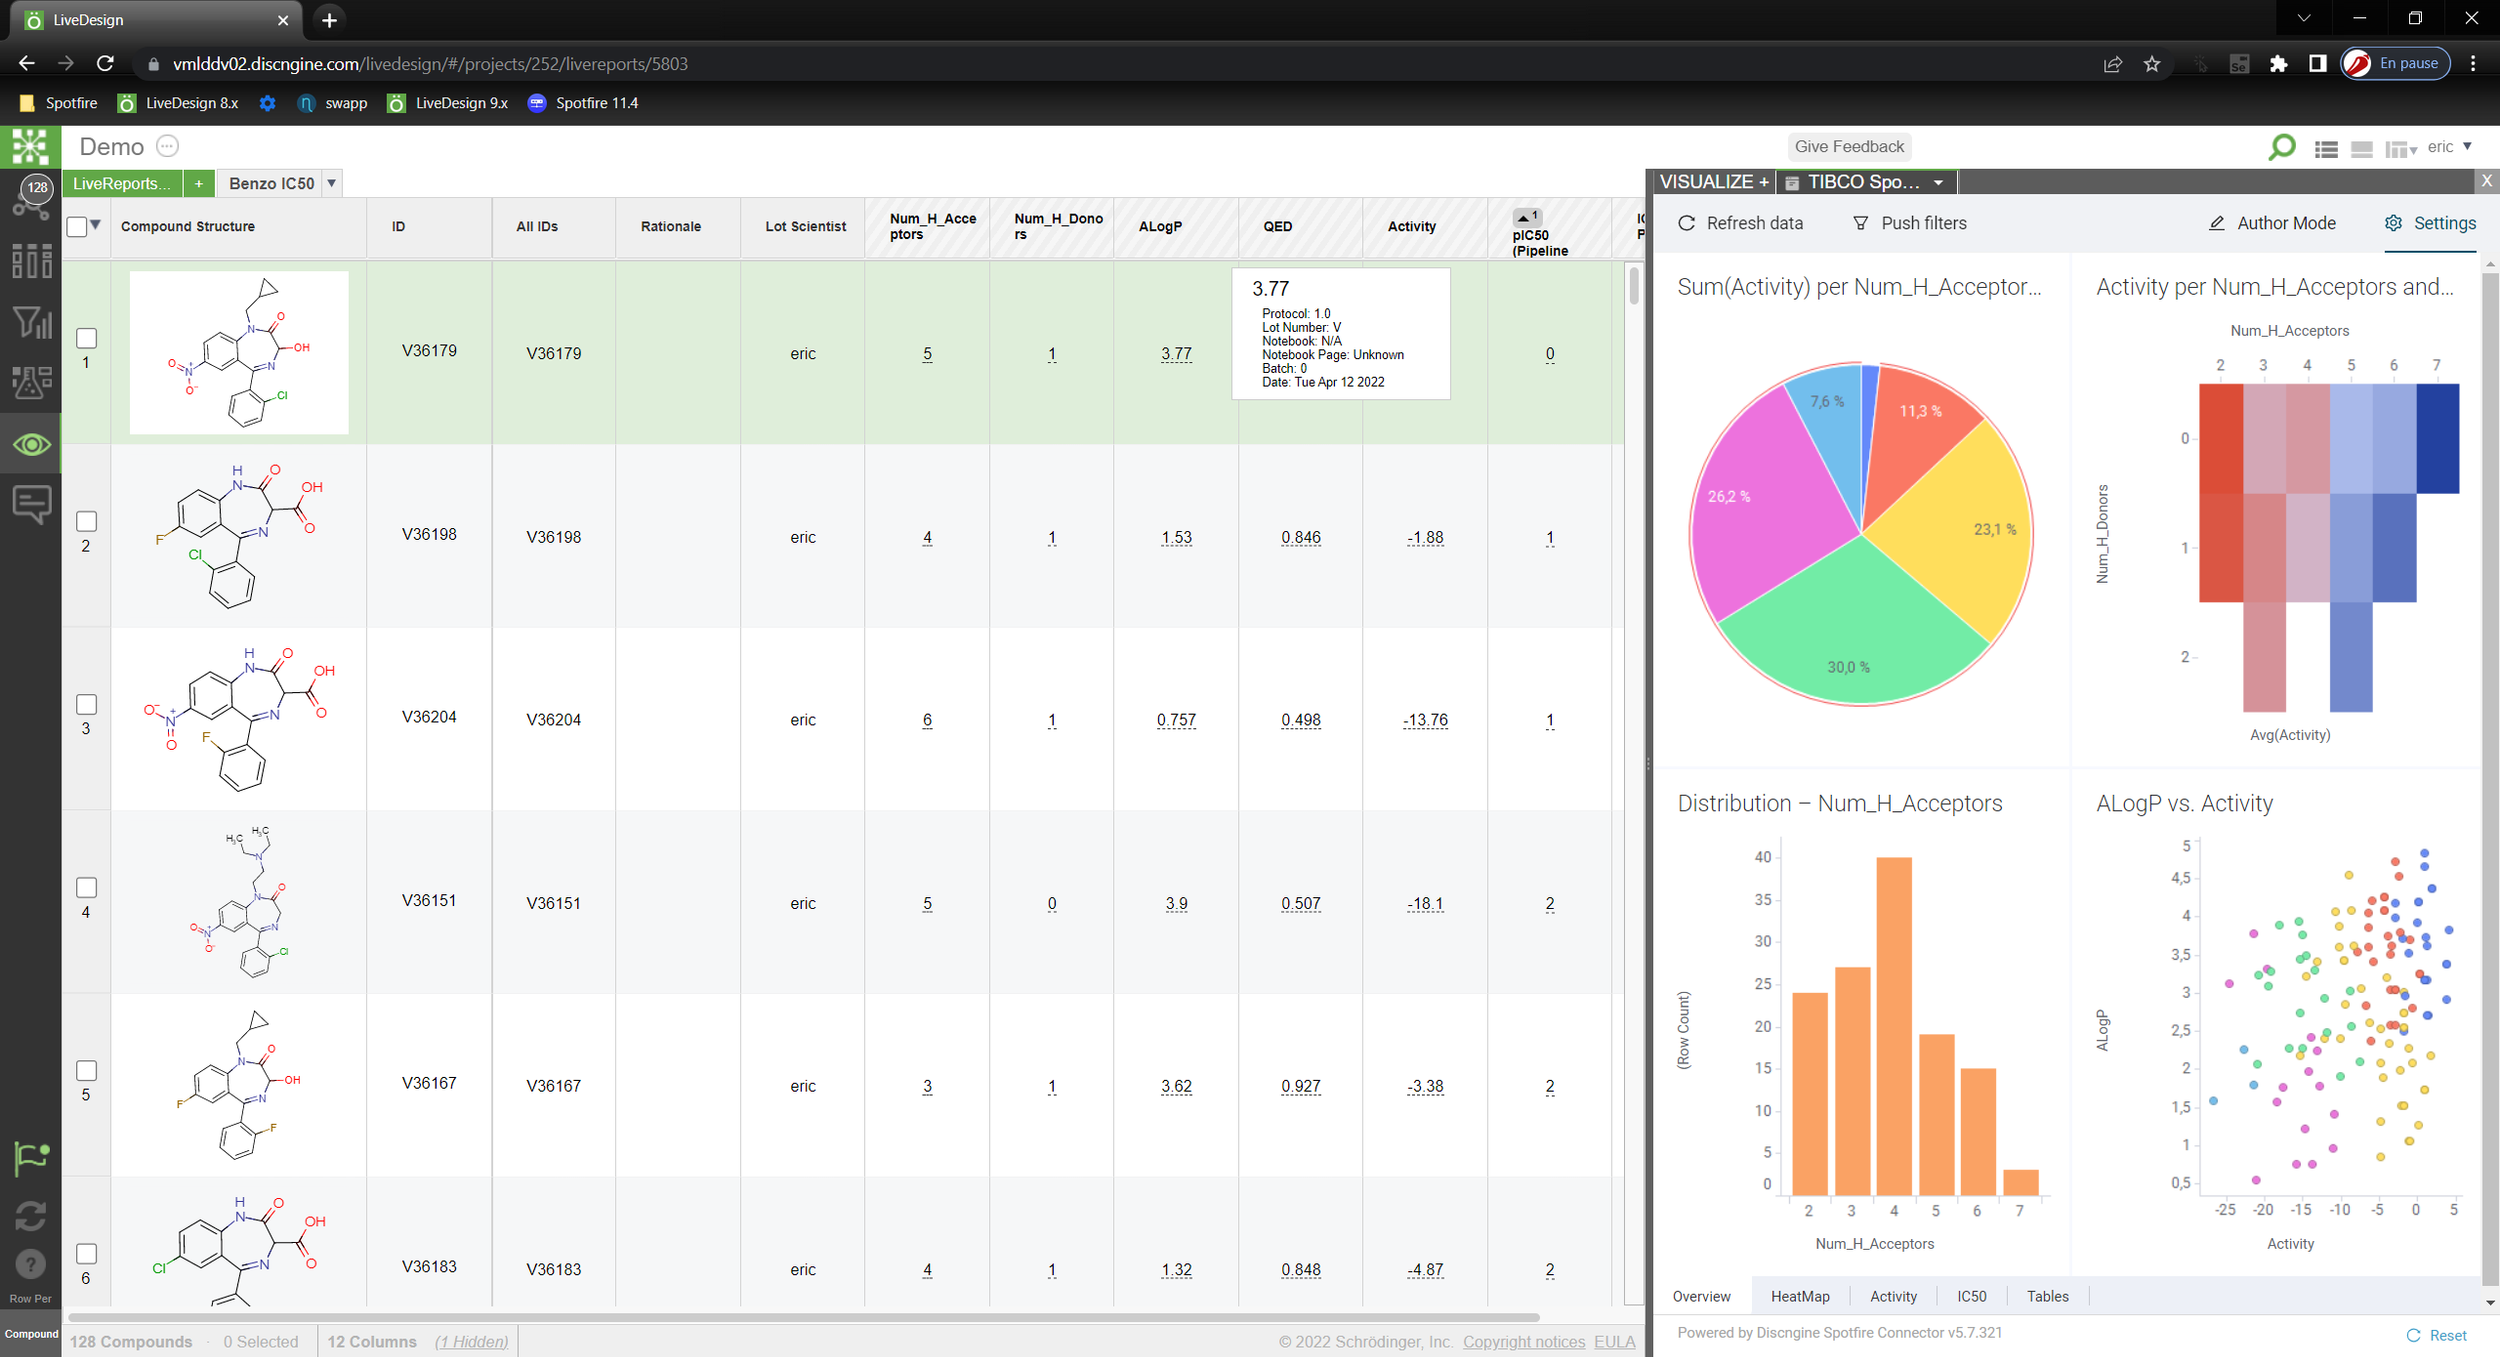
Step 3: LiveReport data is injected in the Spotfire template
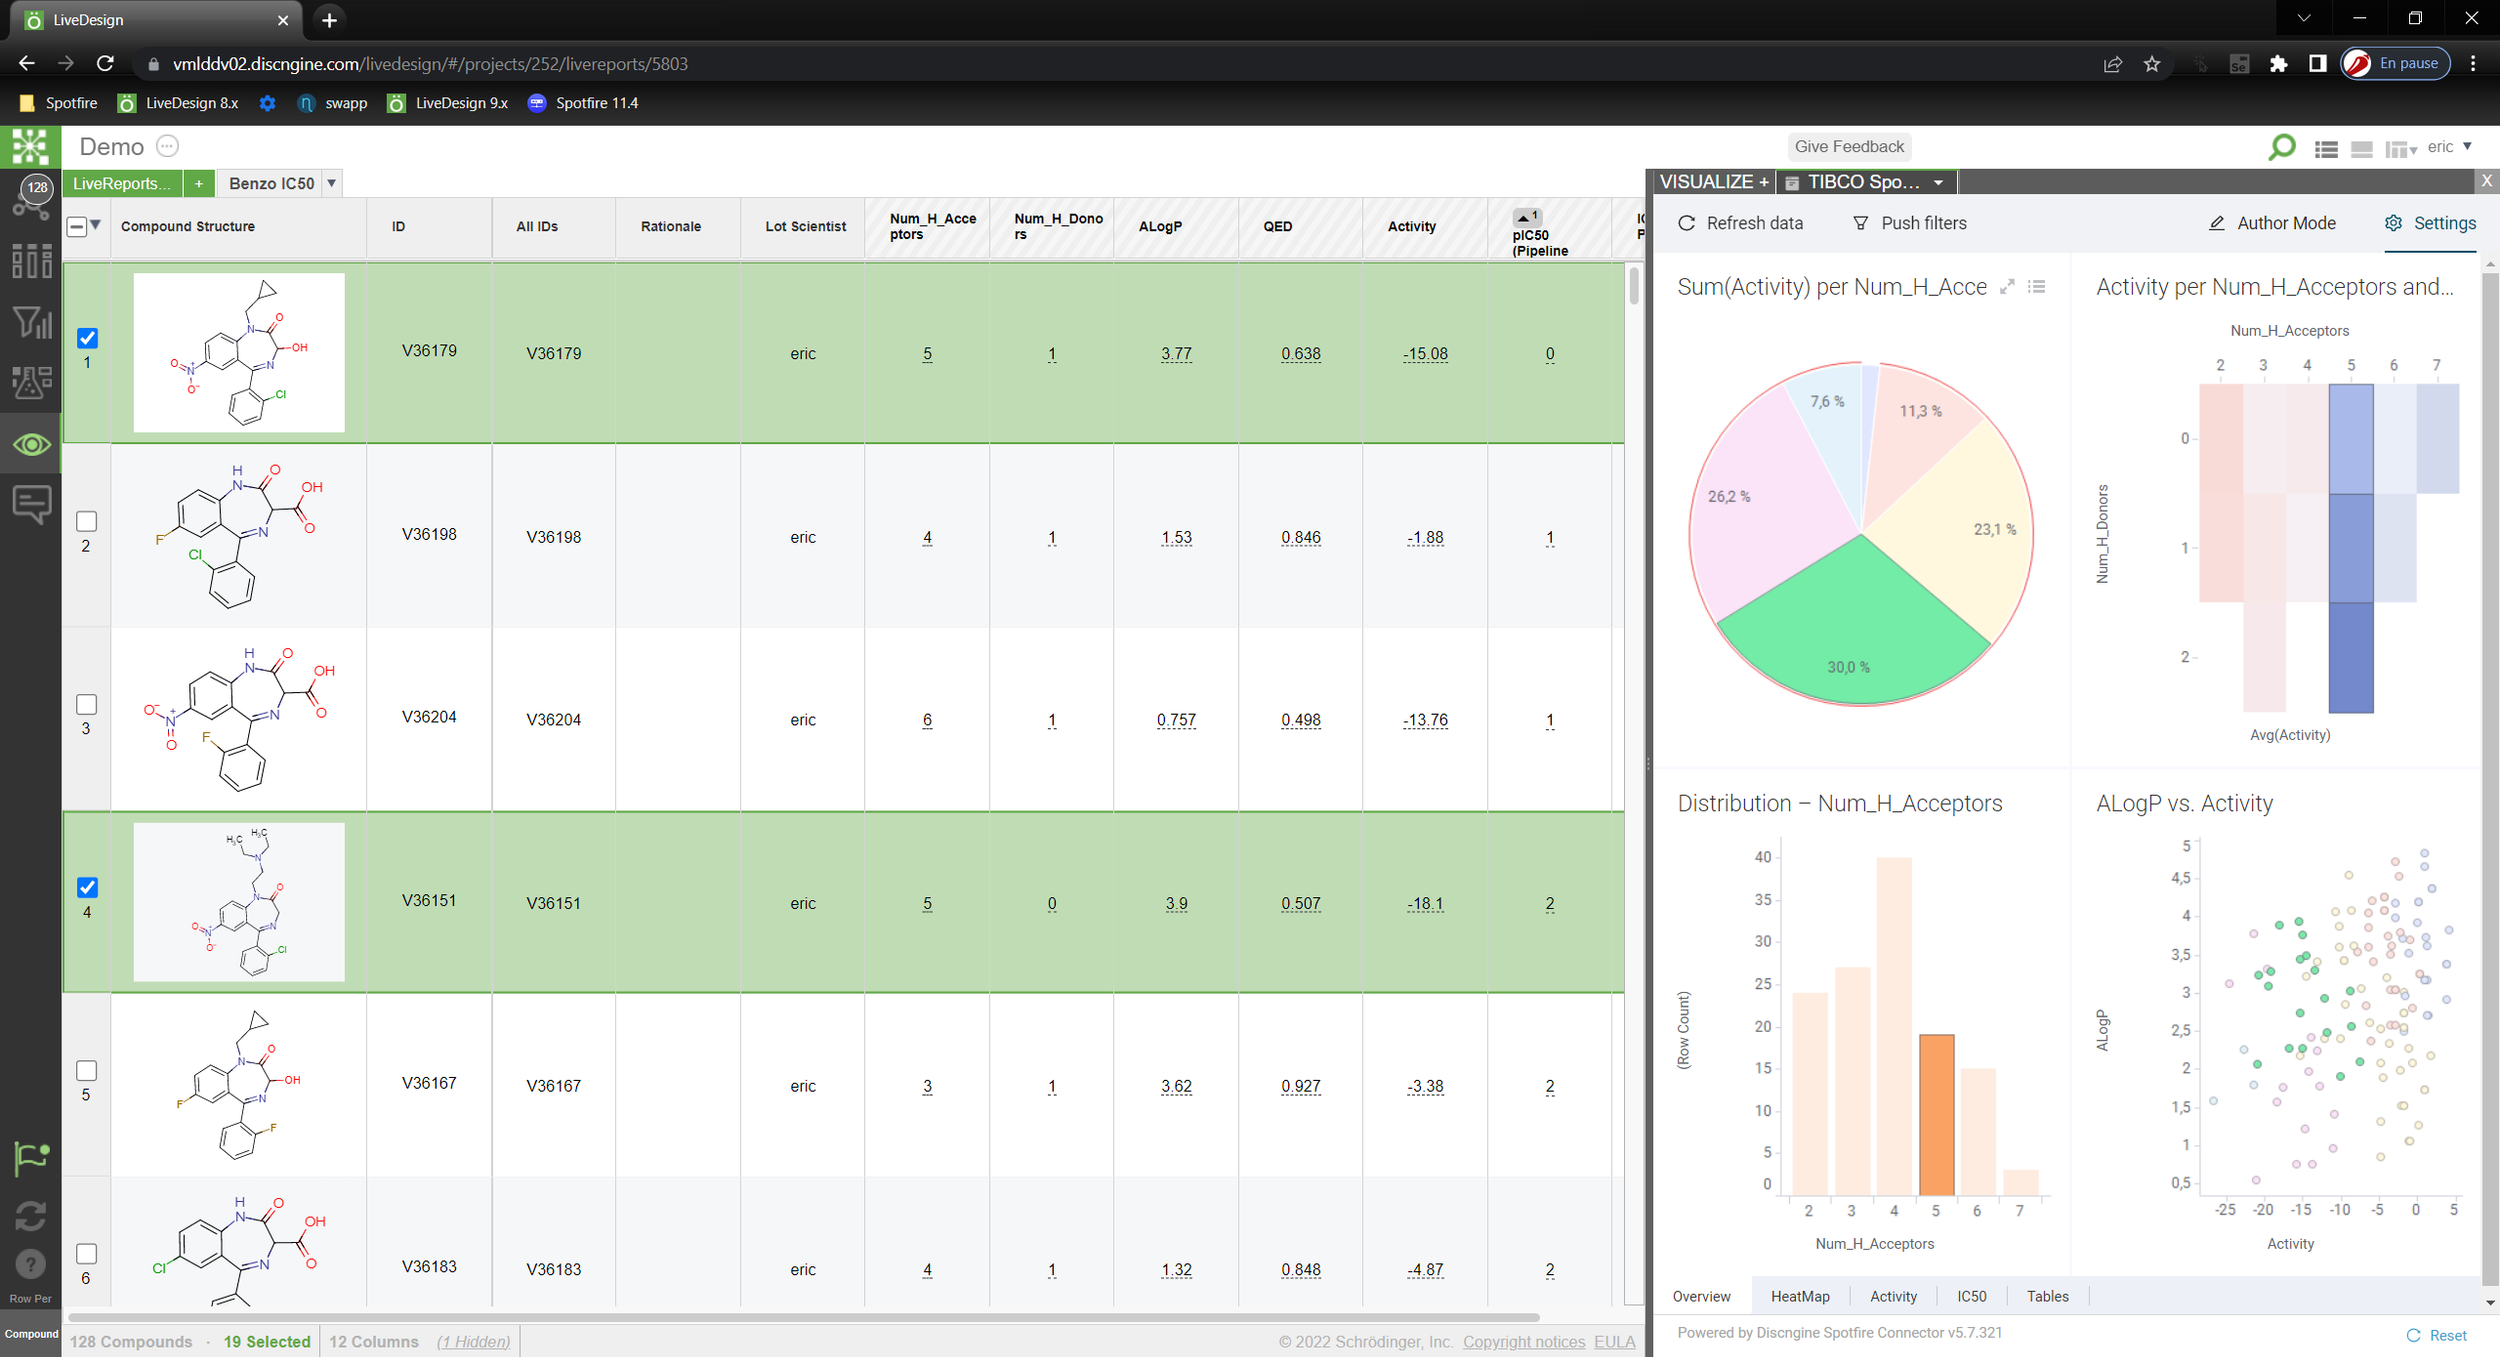
Step 4: Marking/Filtering are synchronized between LiveDesign and Spotfire
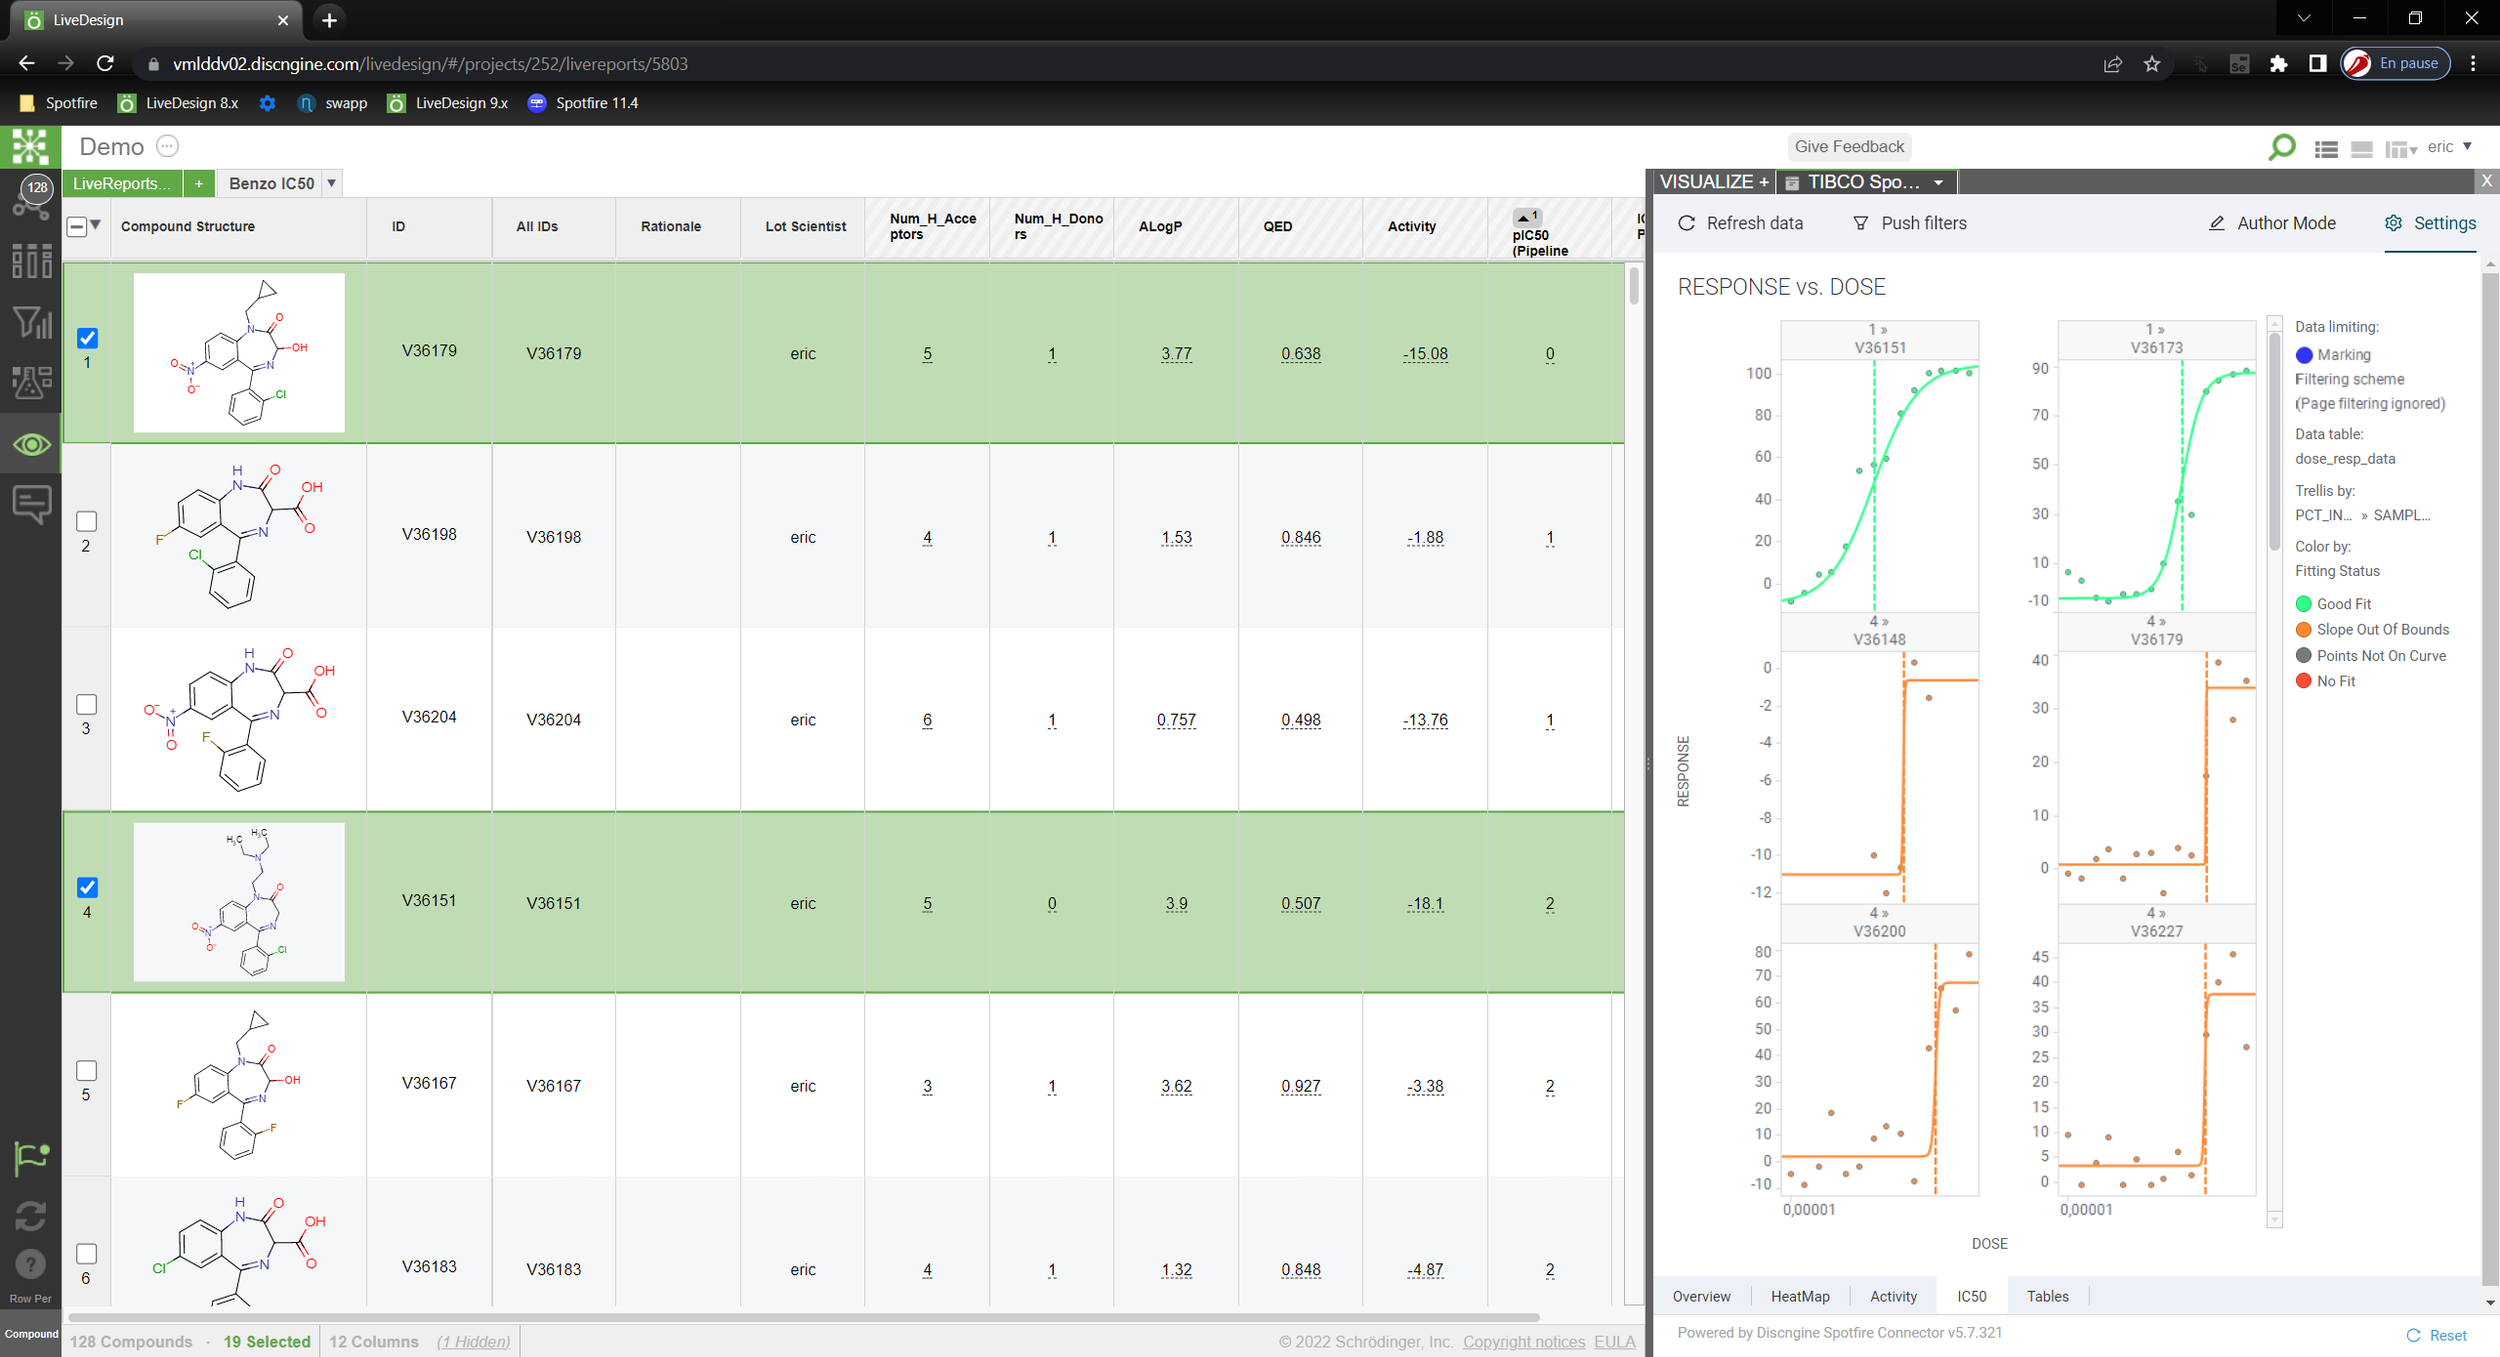
Step 5: Spotfire integration capabilities allow drill down to detailed experimental data
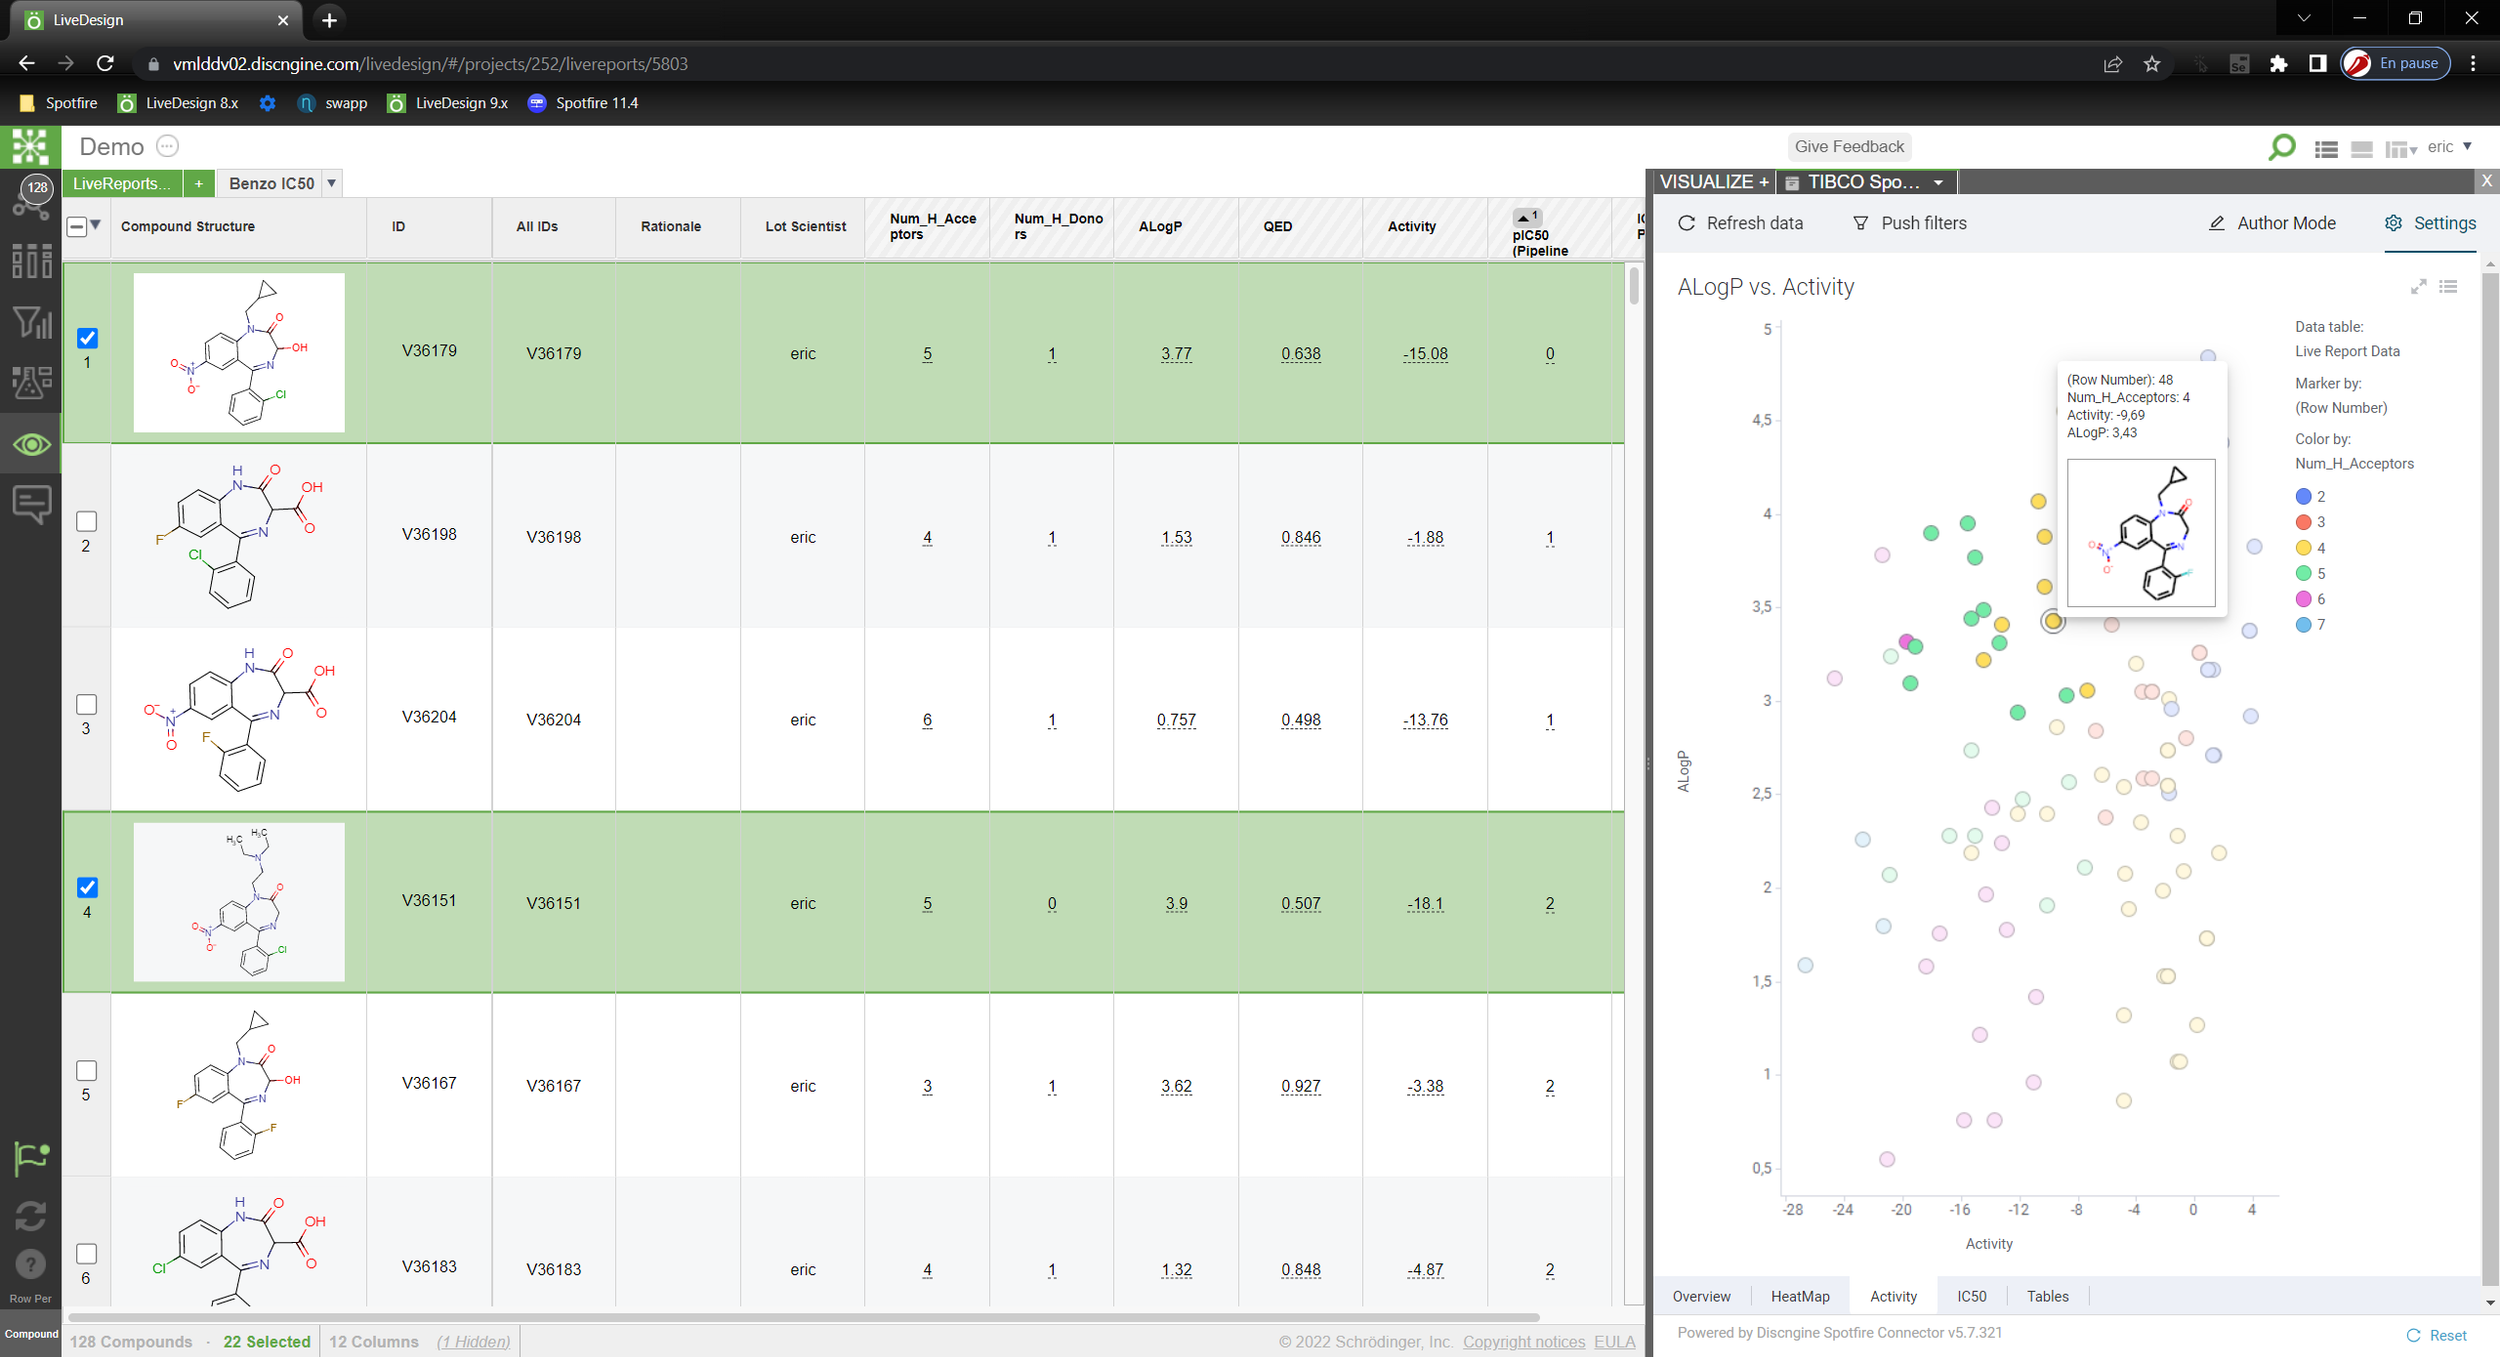
Step 6: Molecular structures are displayed in any visualizations
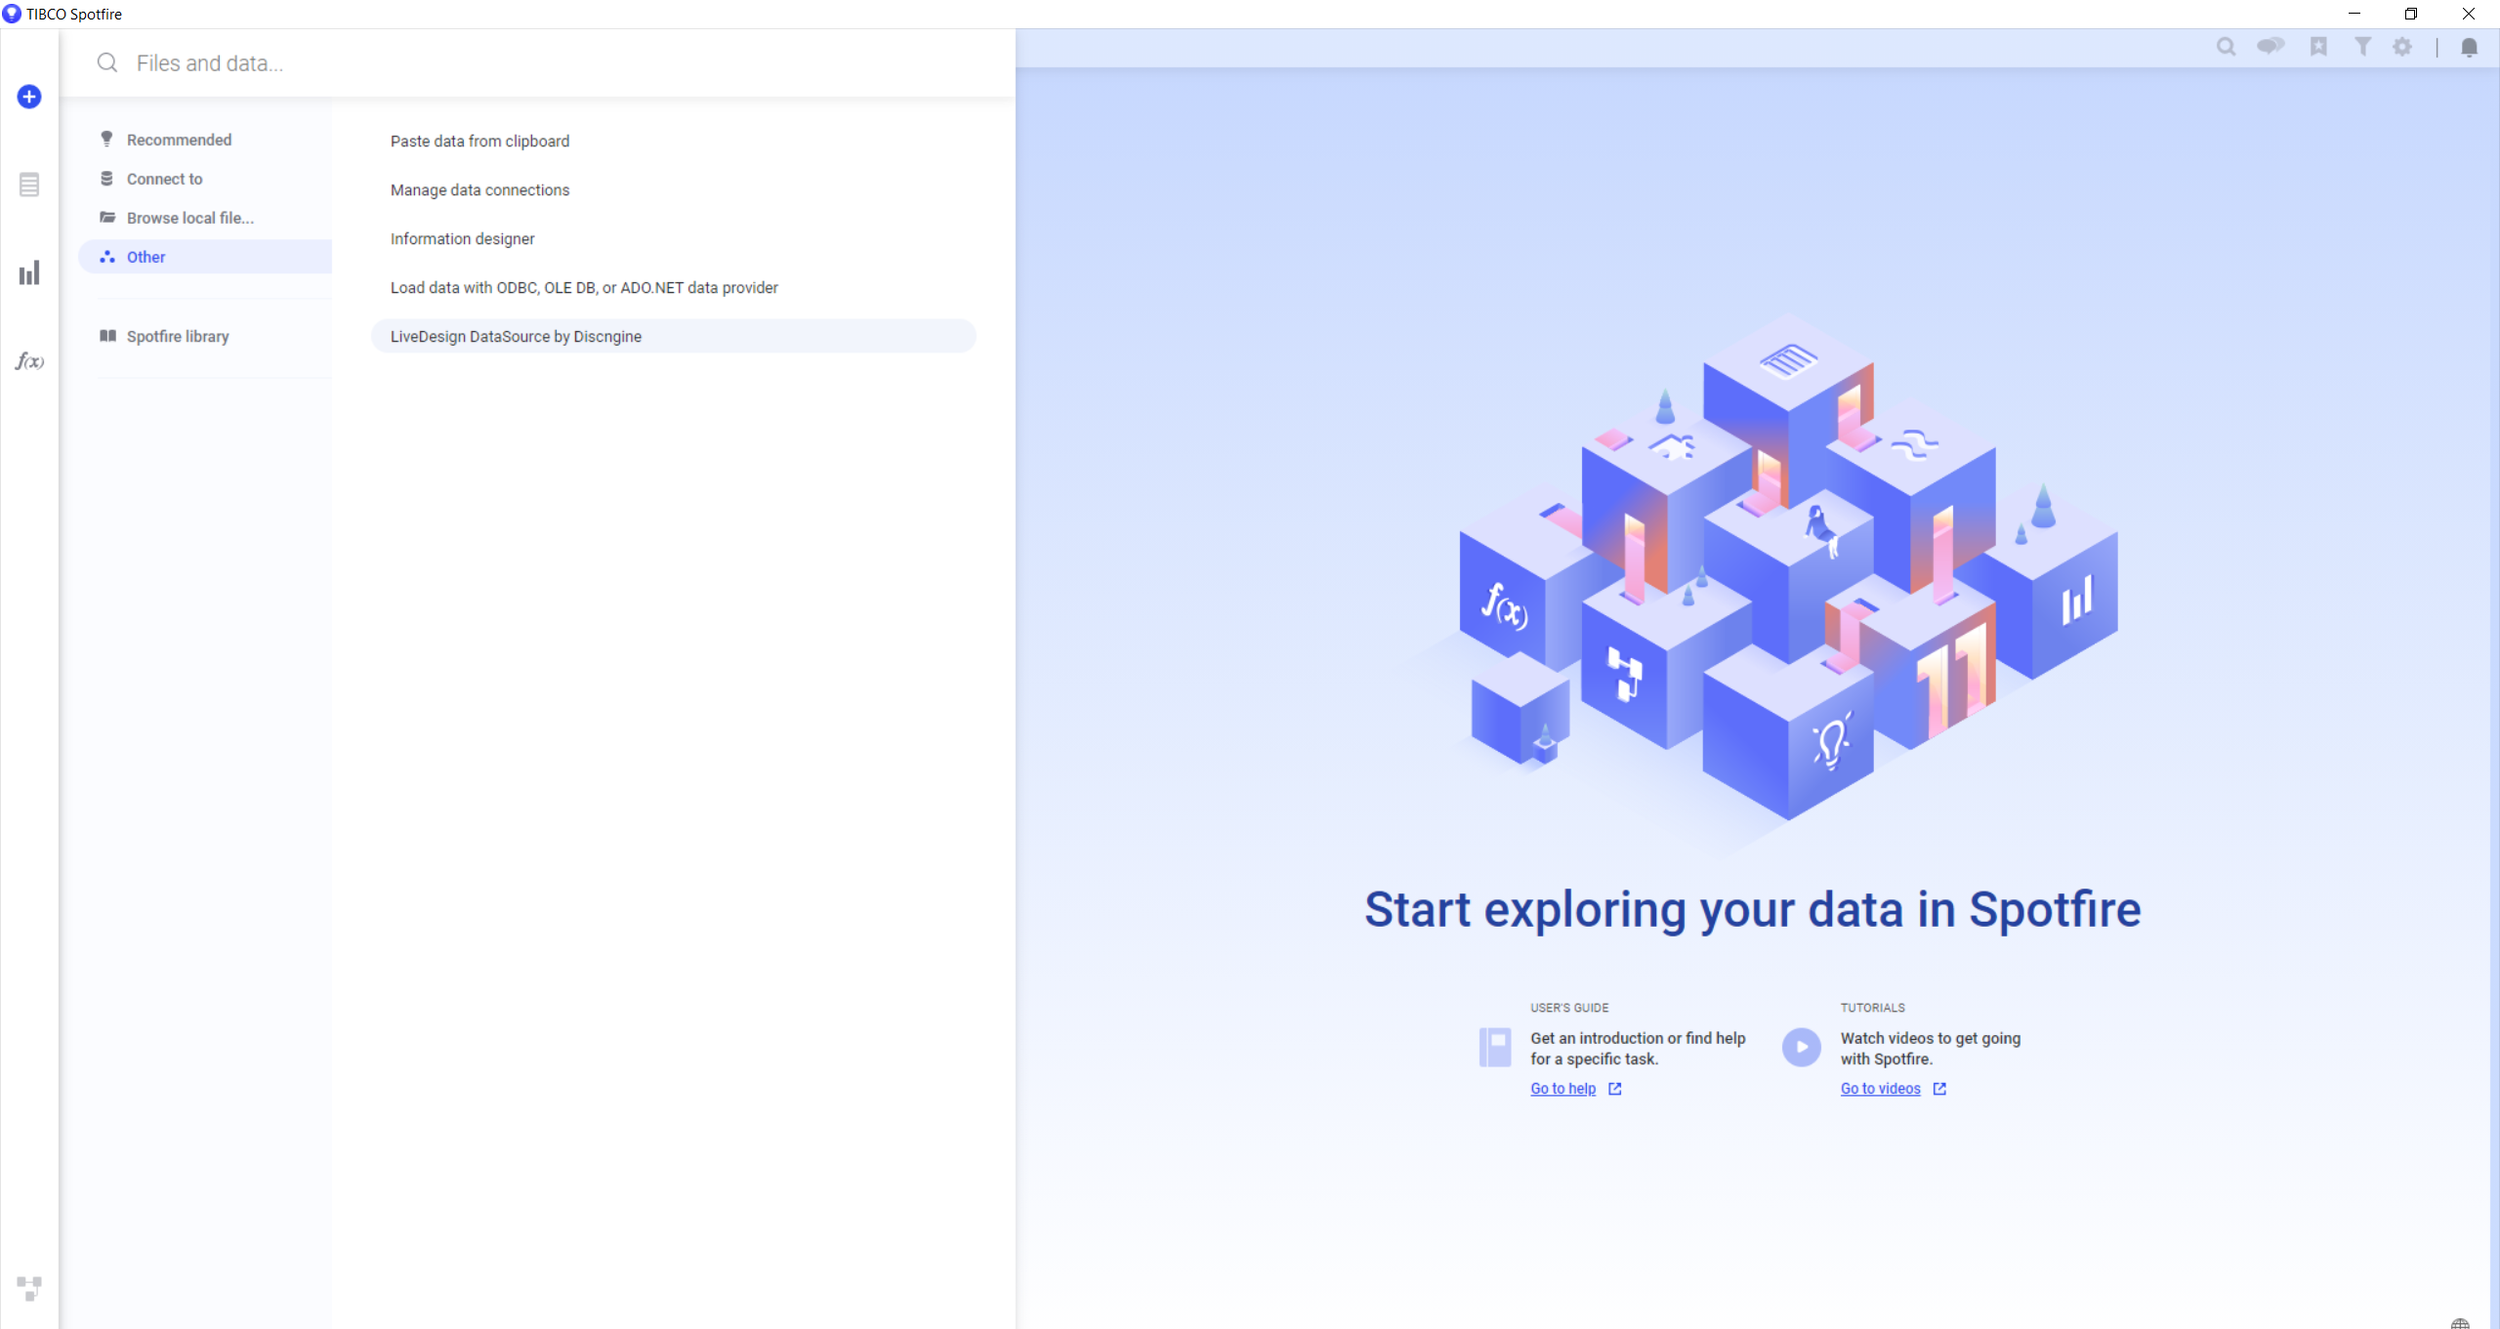
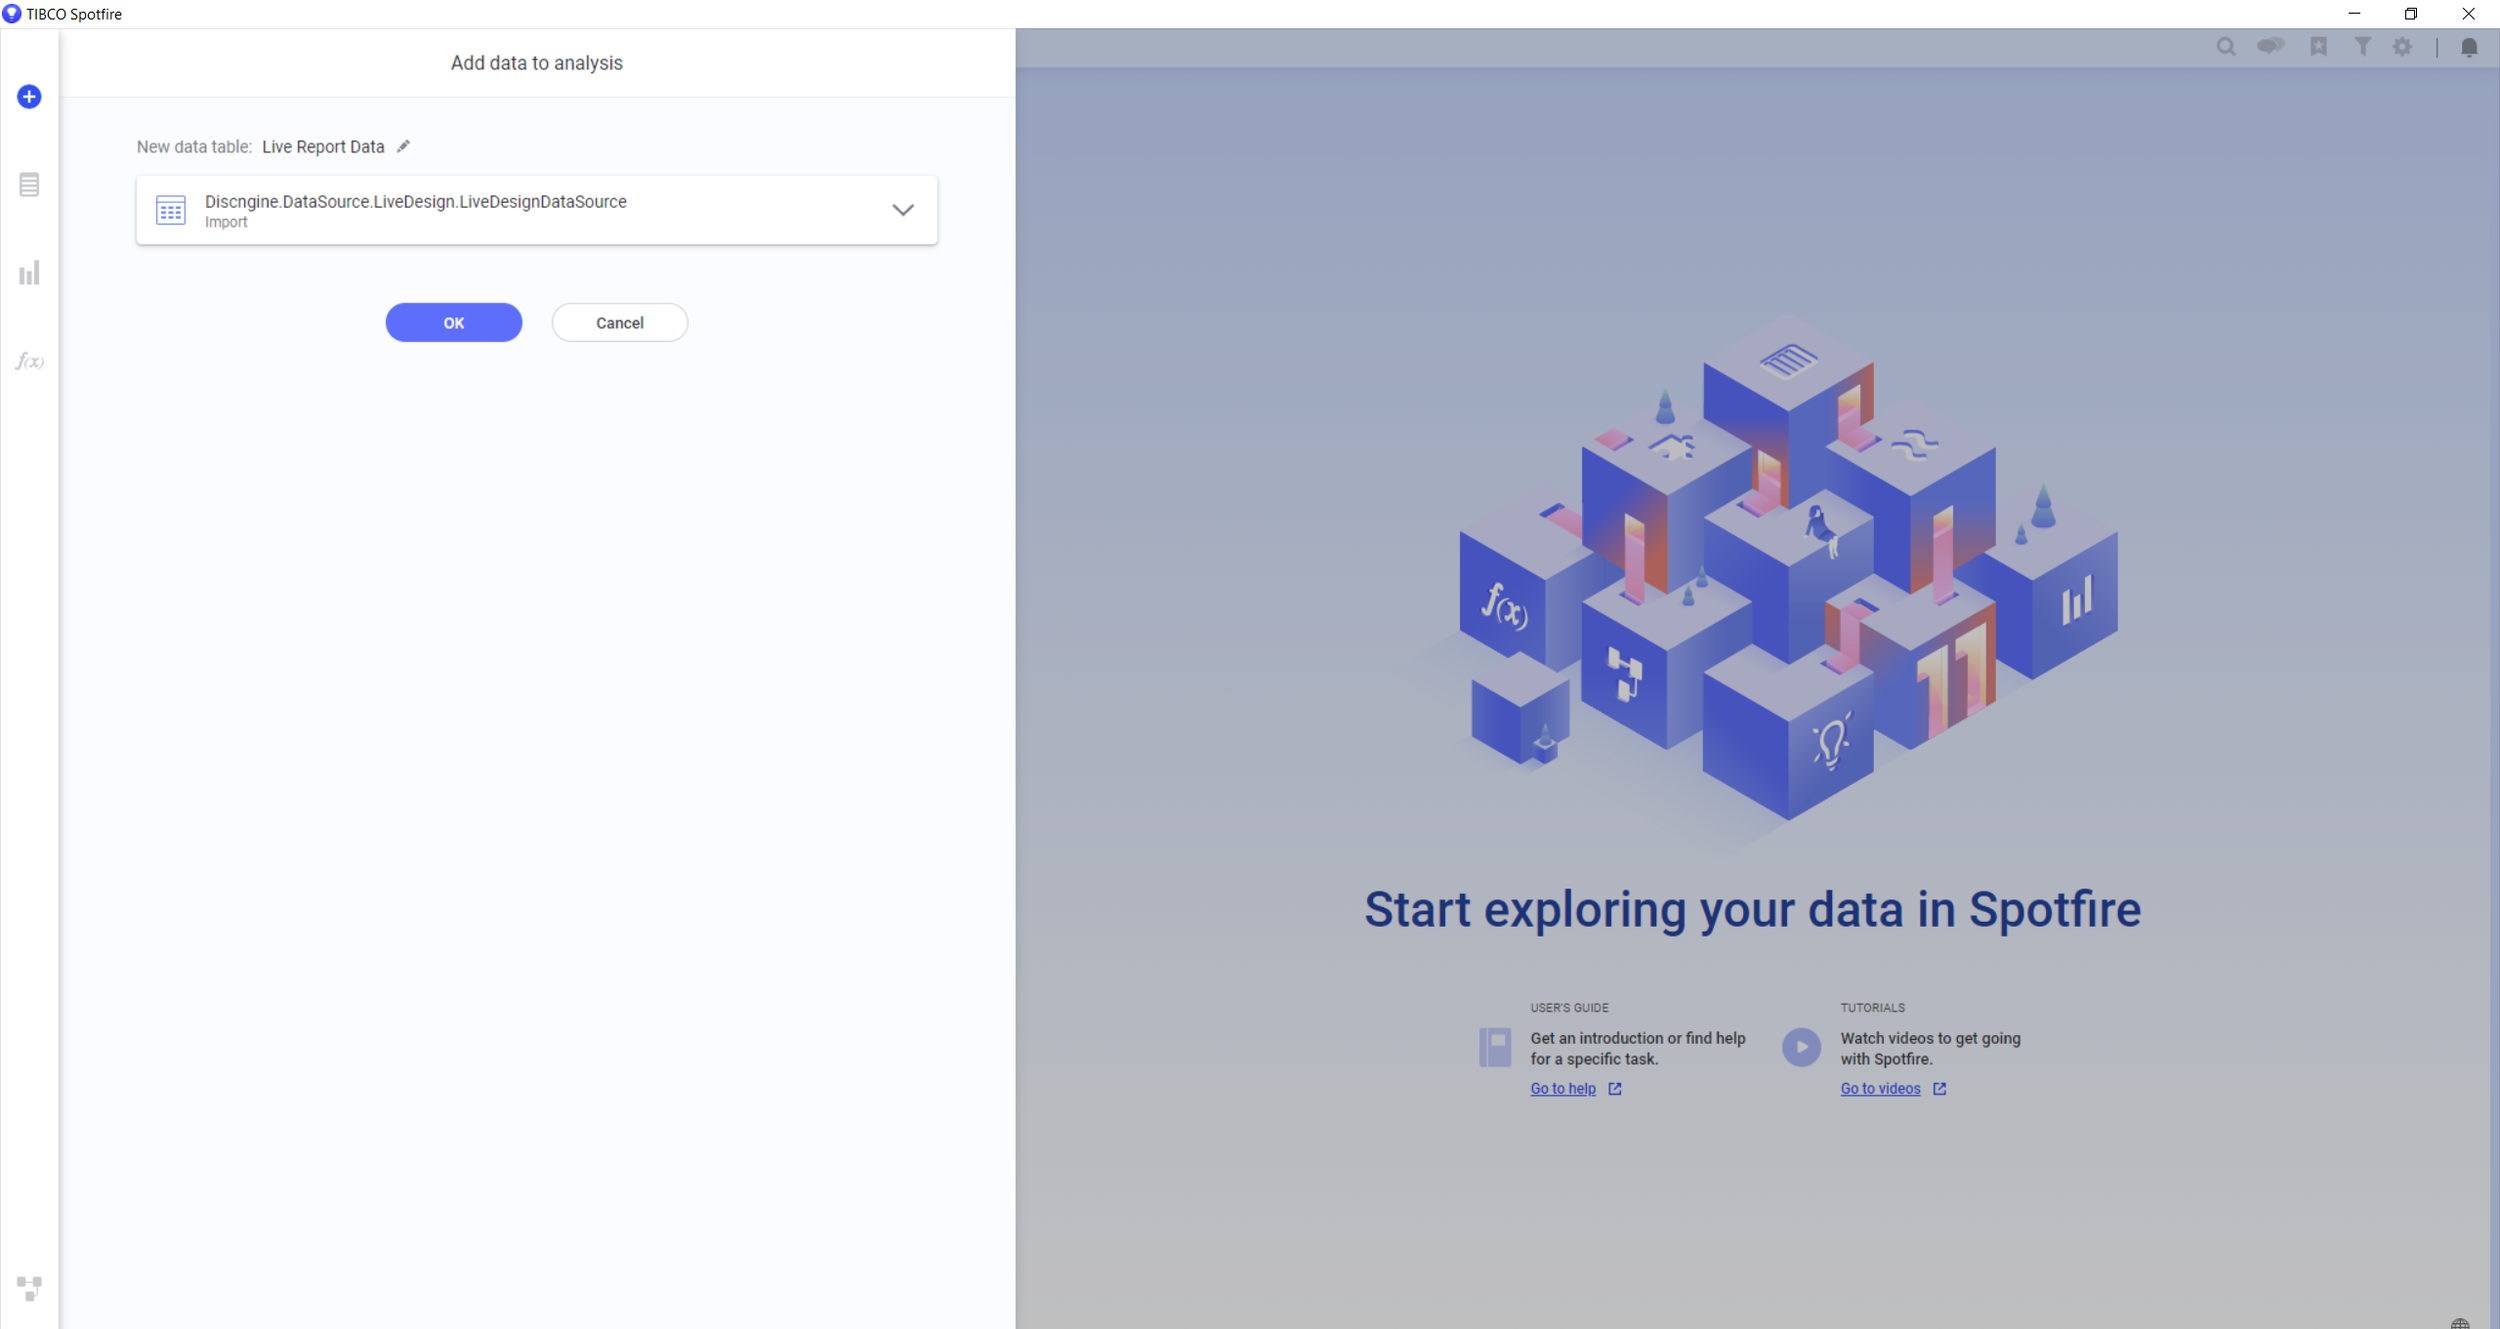
Step 1: Open the LiveDesign data source from the plus menu
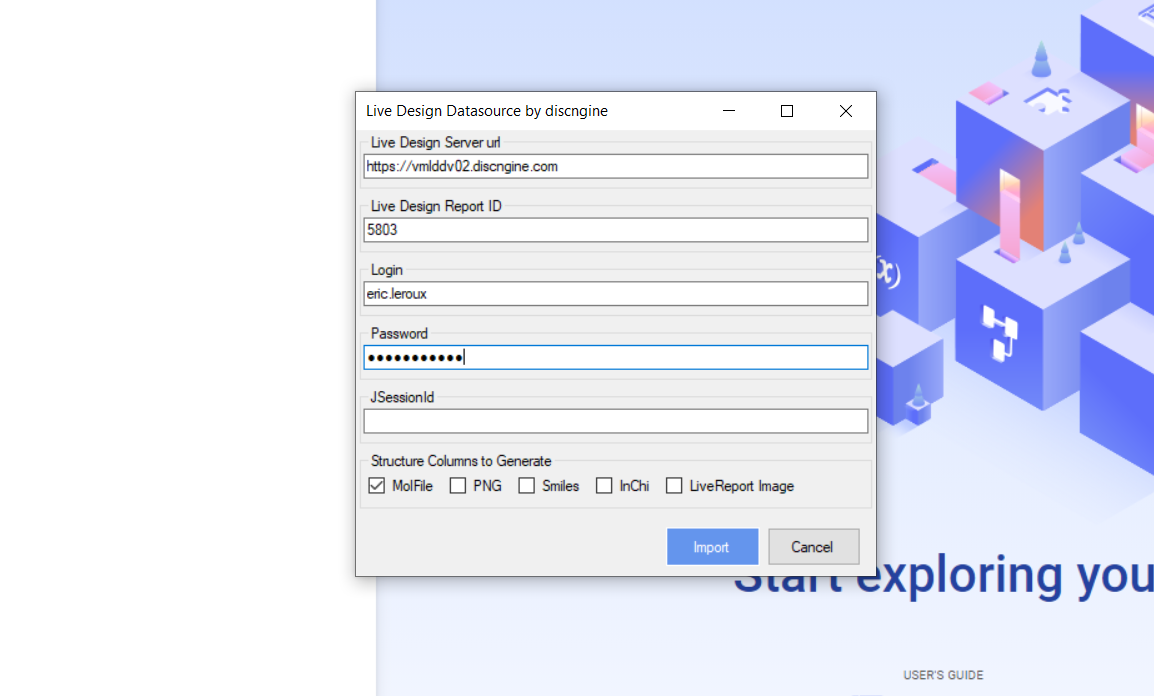
Step 2: Enter the LiveReport parameters
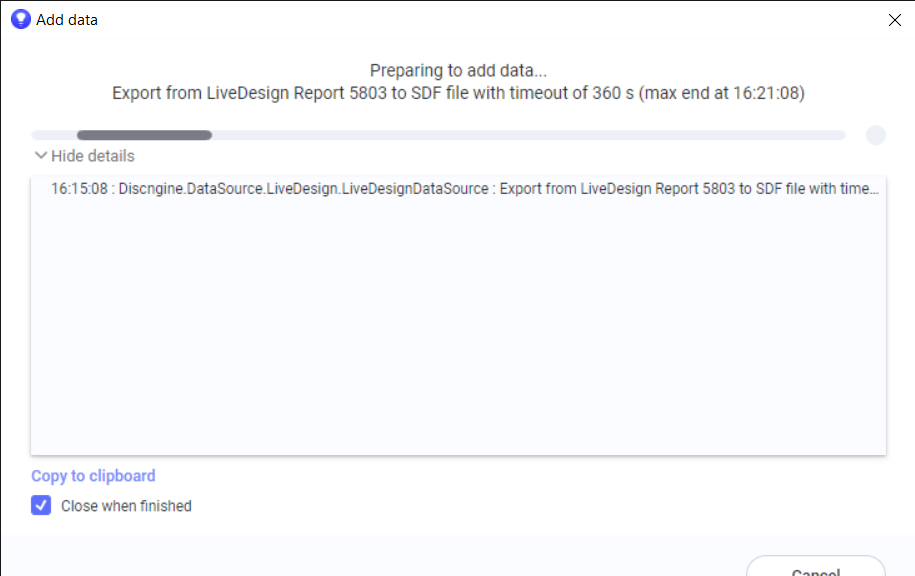
Step 3: Import and convert molecules
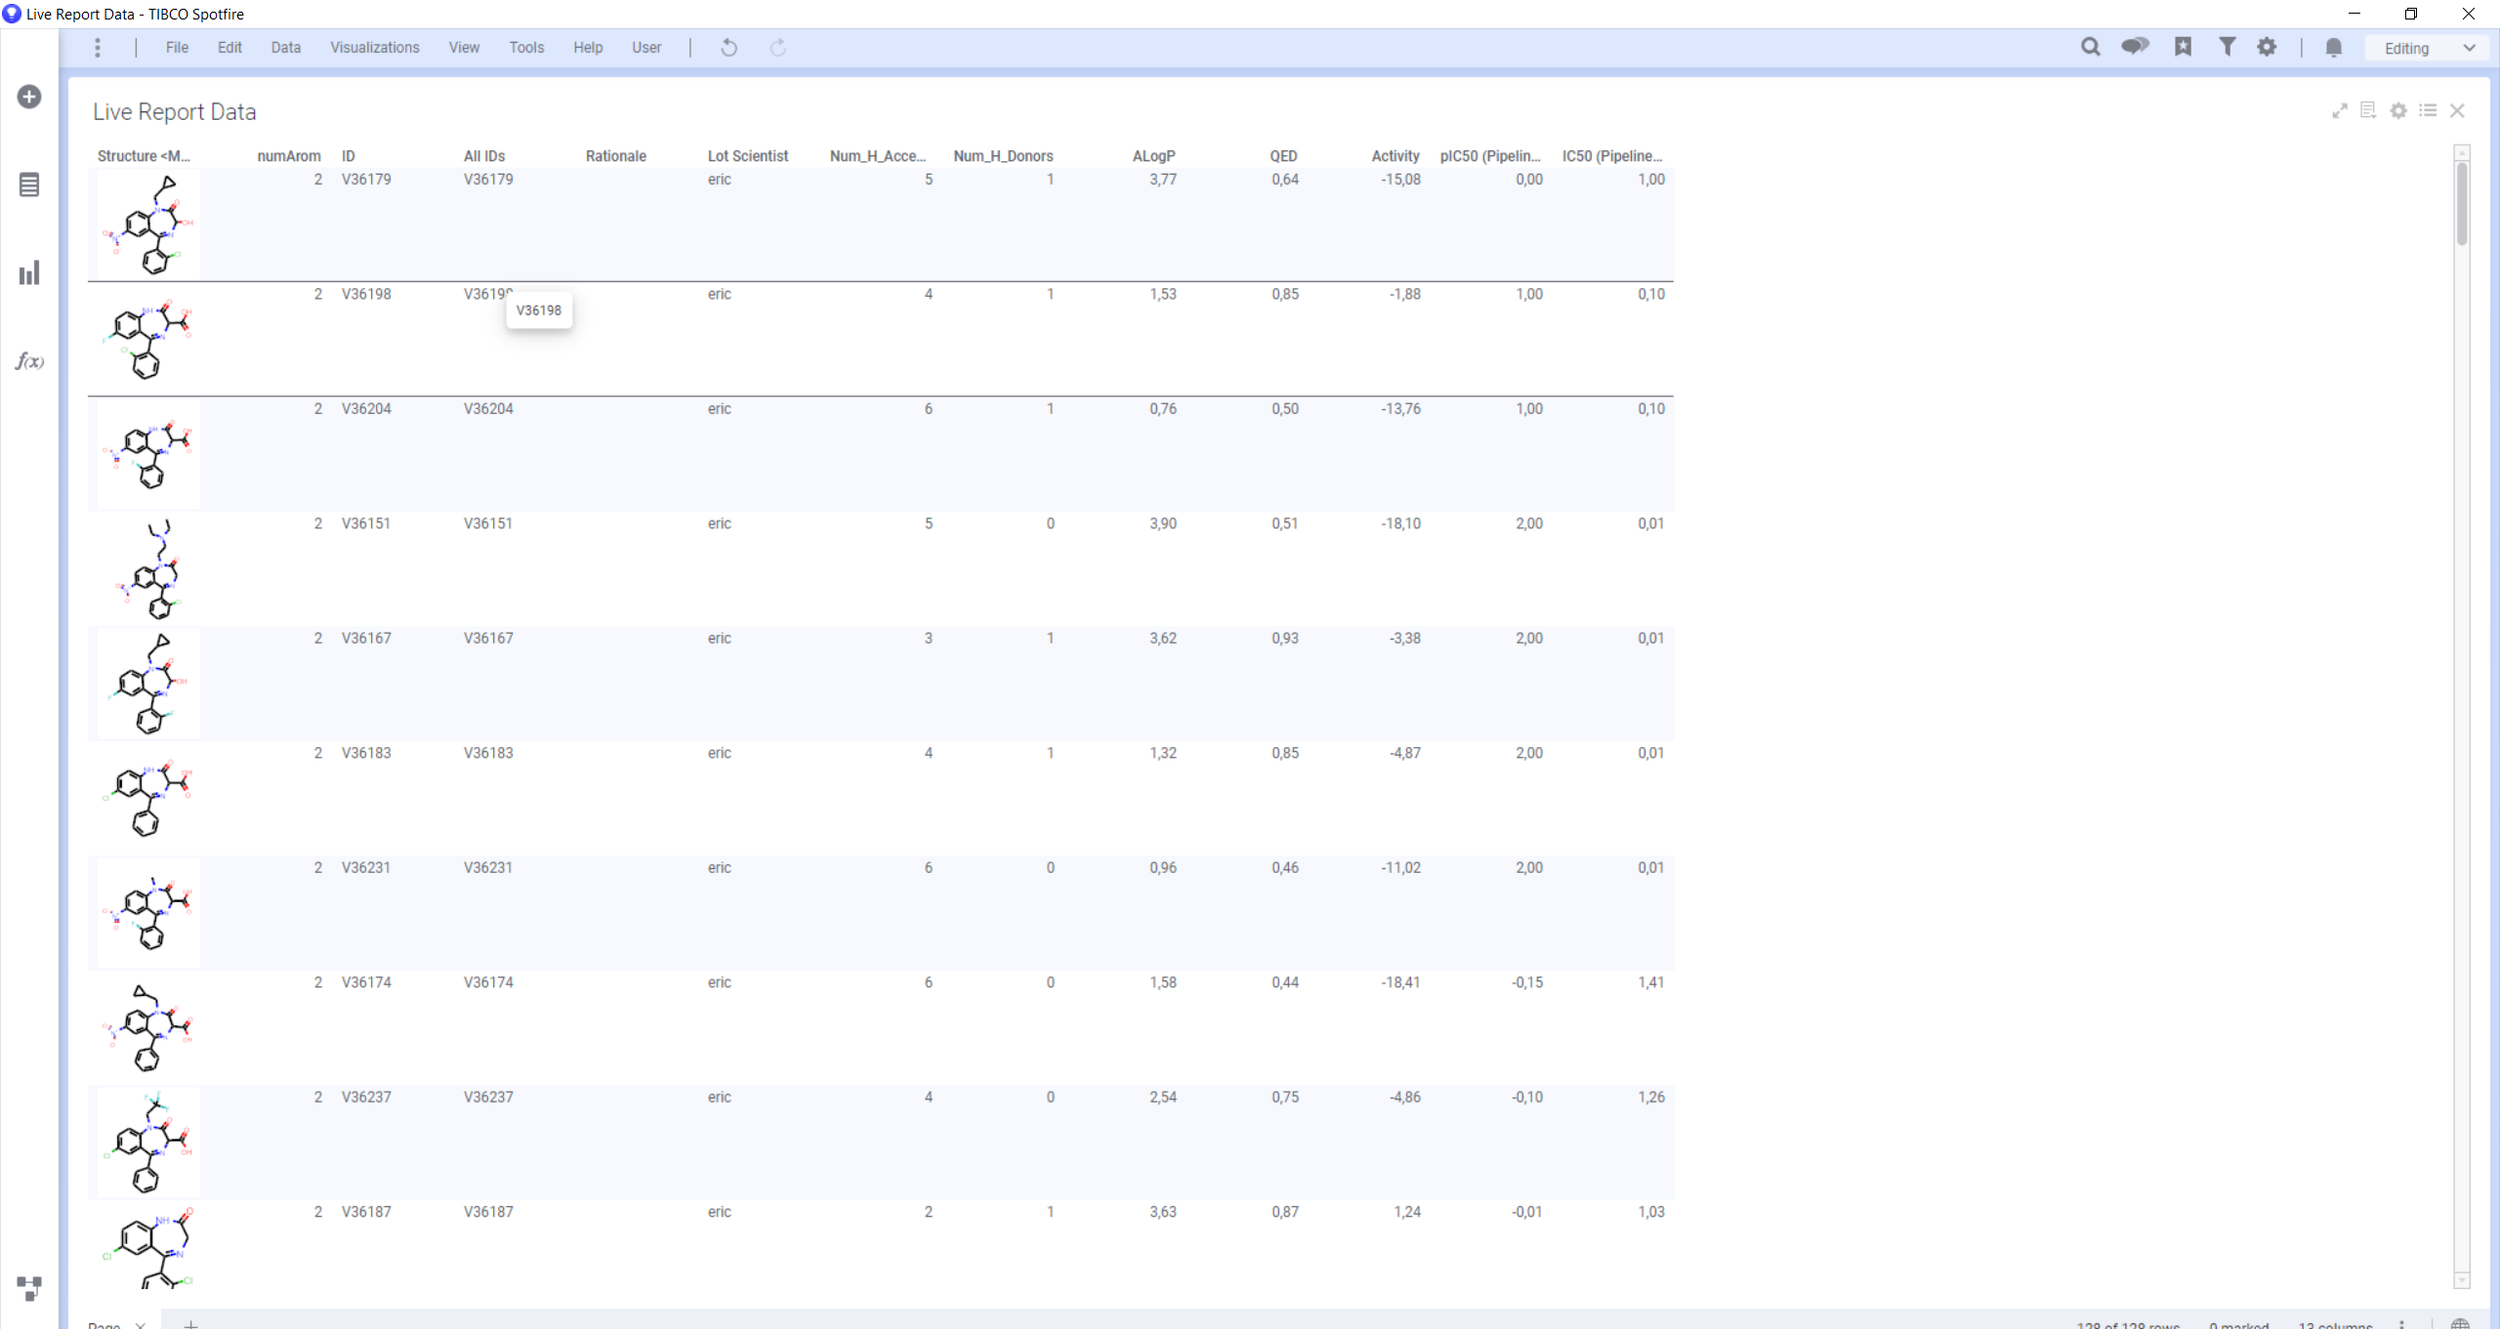
Step 4: Create a new data table with LiveReport data
Step 5: Use Spotfire visualization to render LiveReport data